Course
This procedure is a part of course that teaches you how to build a quickstart. If you haven't already, checkout the course introduction.
Each procedure in this course builds on top of the last one, so make sure you send traces from your product before proceeding with this one.
With New Relic dashboards, you observe and interpret the data you collect from your application. You gather the data you want to see into charts to customize the way you see it.
In this procedure, you create a dashboard in New Relic.
Create a dashboard
Navigate to New Relic and sign in with your account. Here, you see different tabs such as Browser, Dashboards, Alerts & AI in the left hand navigation.
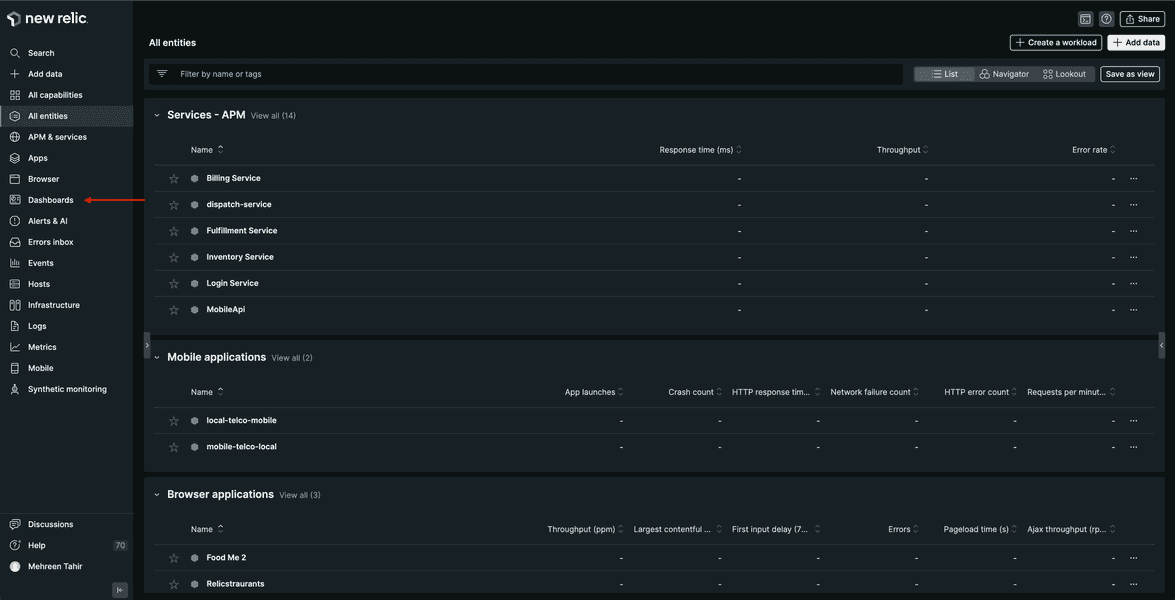
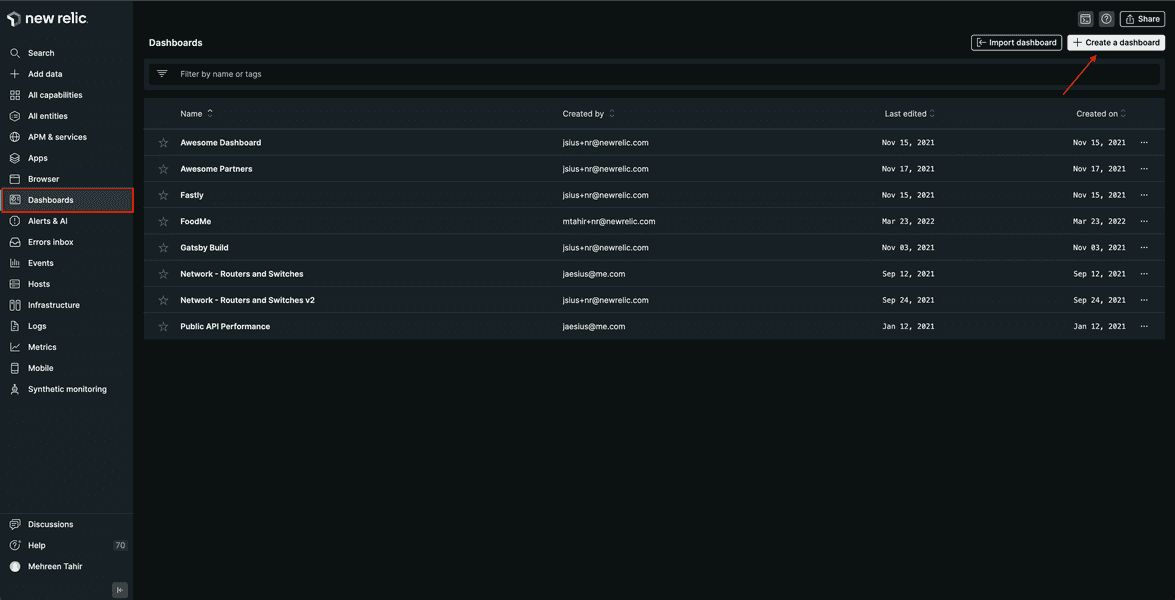
Move to Dashboards and click Create a dashboard in the top right corner.
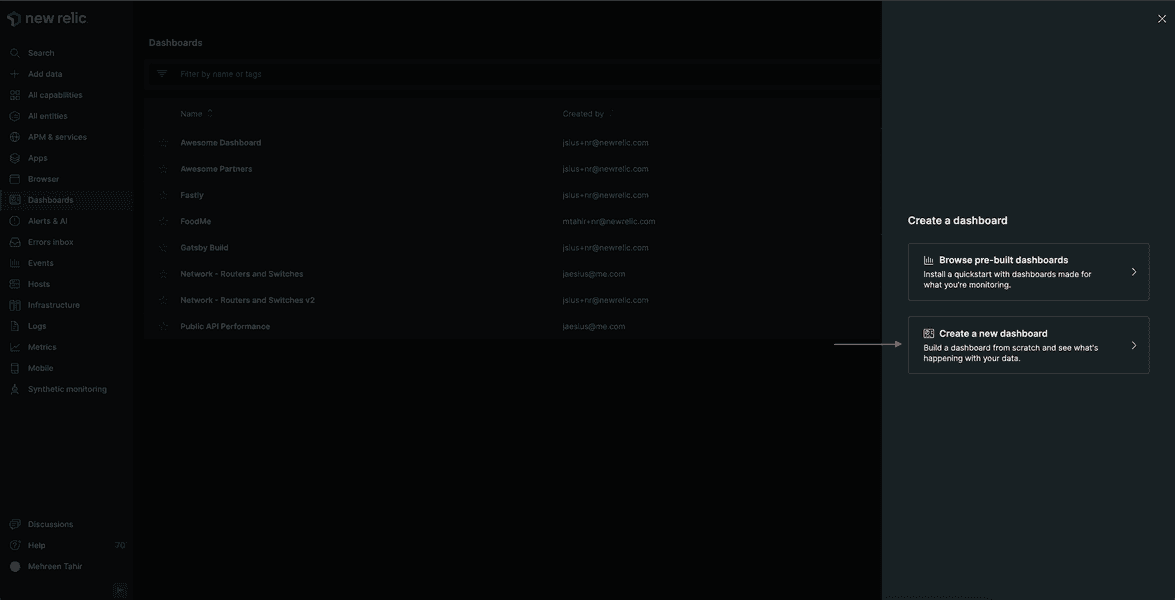
Here, select Create a new dashboard.
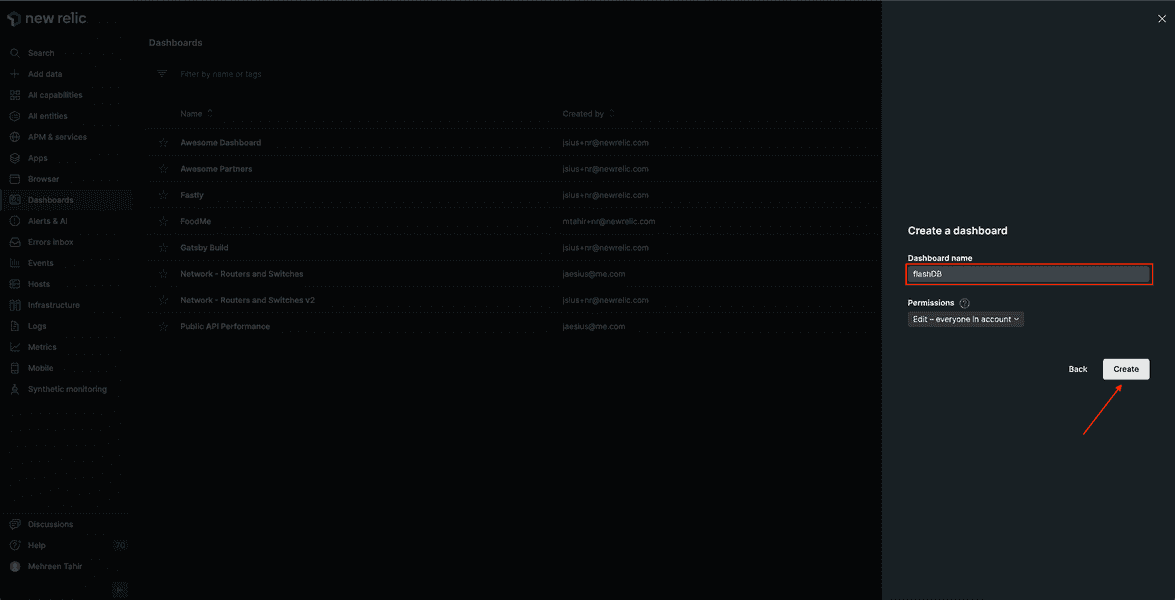
Name your dashboard "FlashDB" and click create.
Add charts to your dashboard
Once the dashboard is in place, you can start creating charts. You're going to add the following charts:
- Database methods
- Average response time
- Errors
- Database size
- Cache hits
- Keys
Database methods
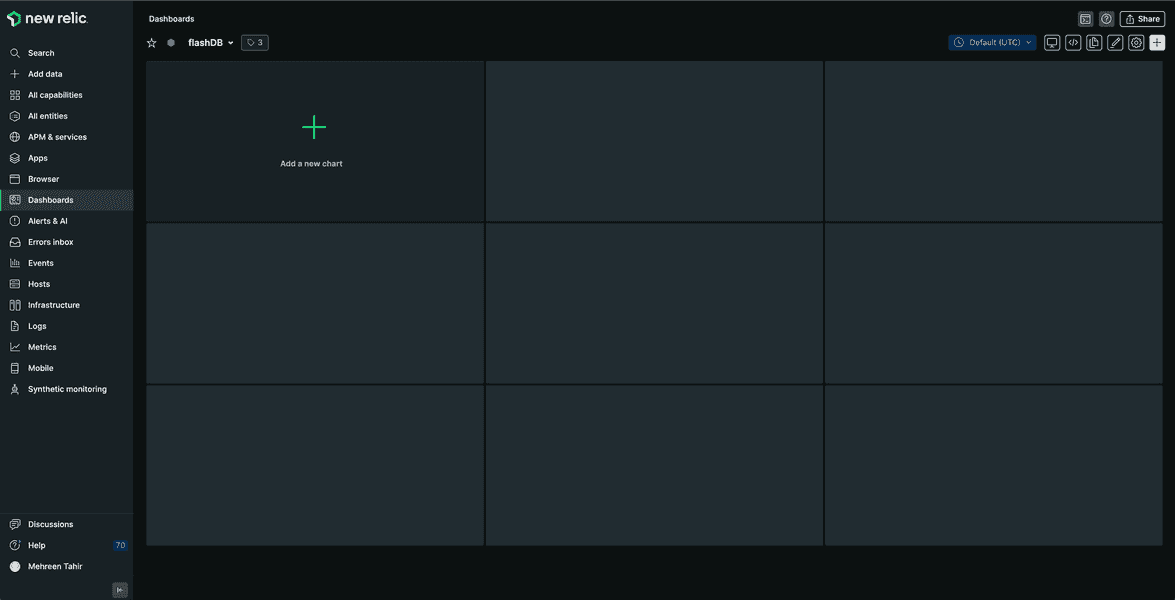
Hover over the dashboard and click Add a new chart.
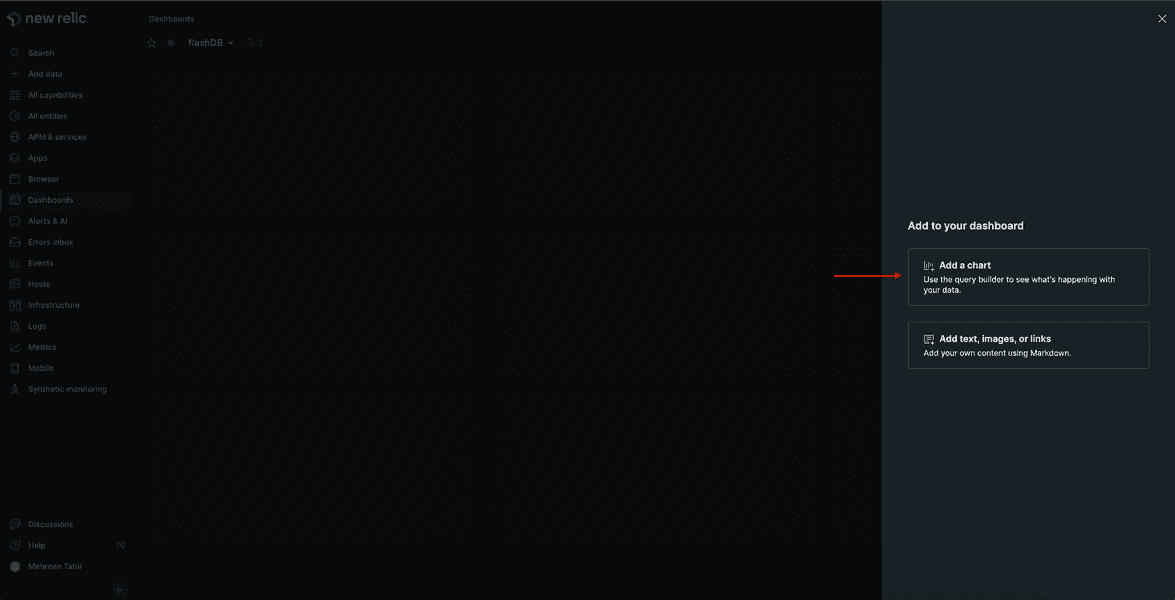
From this screen, you add charts using our query builder, or you choose to add text, images, or links using Markdown. Click Add a chart.
It may open the query builder option. Switch to the NRQL editor and edit the query as follows:
SELECT count(*) FROM fdb_method FACET methodClick Run to see above results.
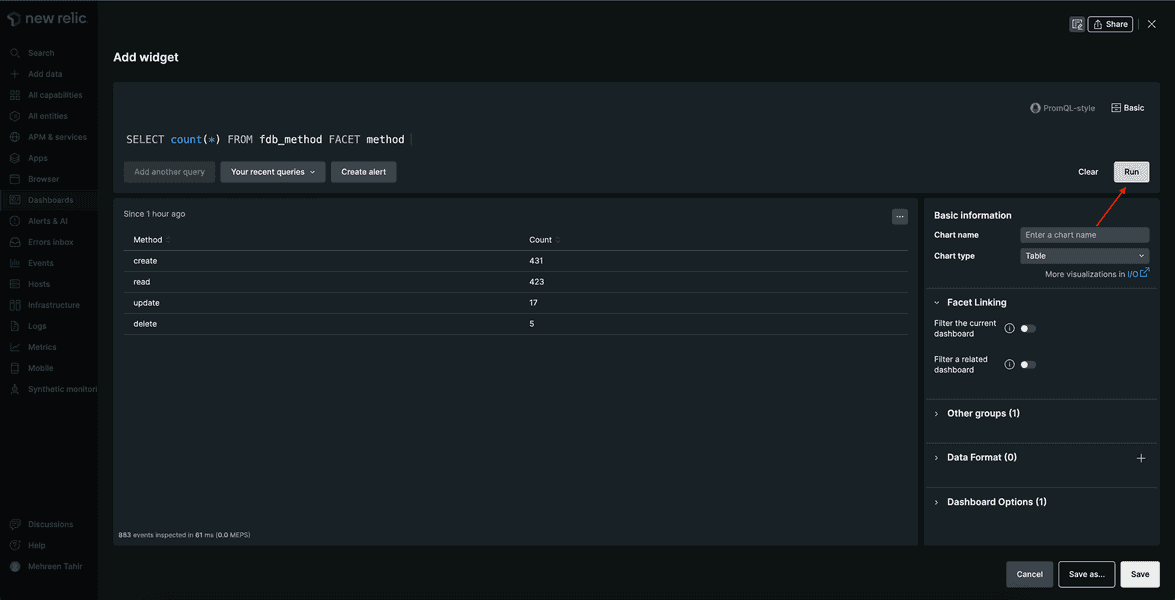
Here, you see the count of each FlashDB query, grouped by method. You can choose to present your results in different formats such as table, billboard, or pie chart.
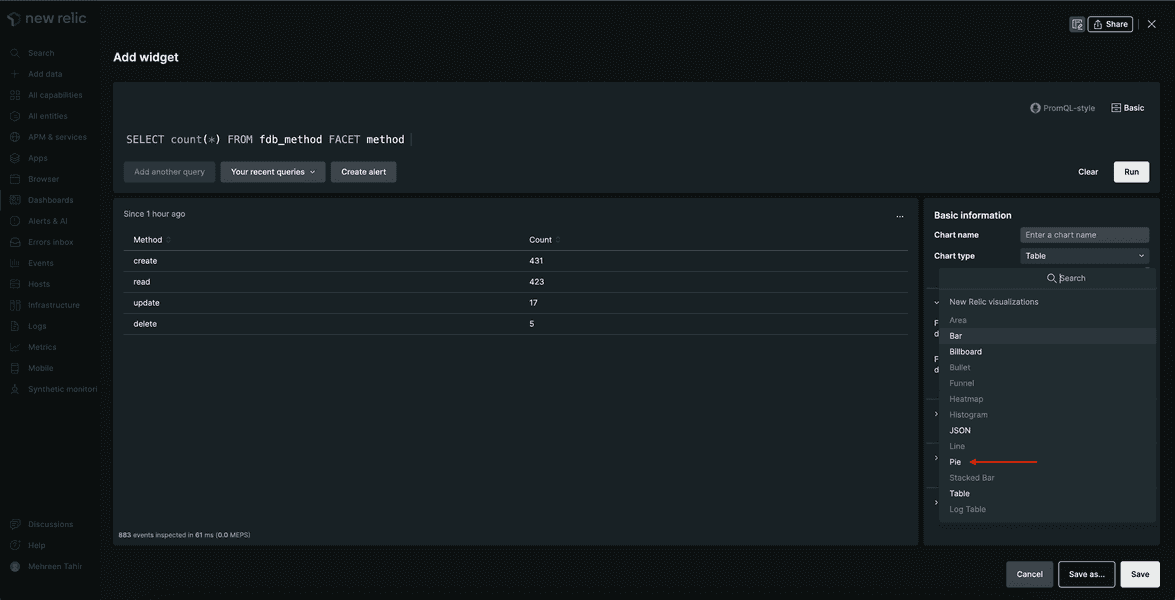
Change the chart type to pie, name your chart "Database methods", and click save.
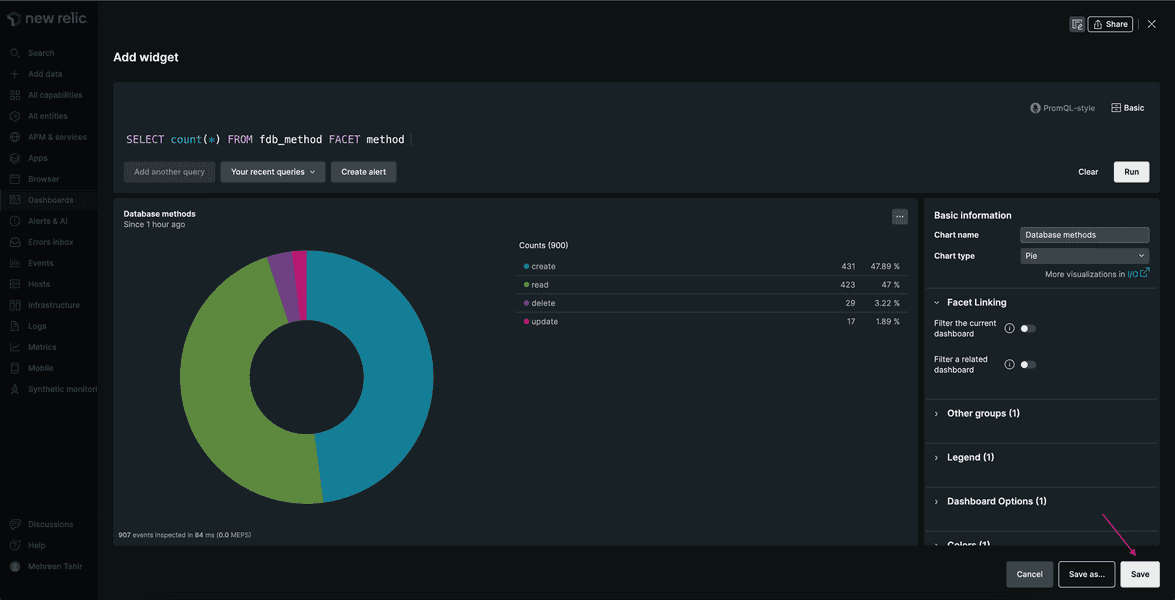
The chart is now visible on your dashboard.
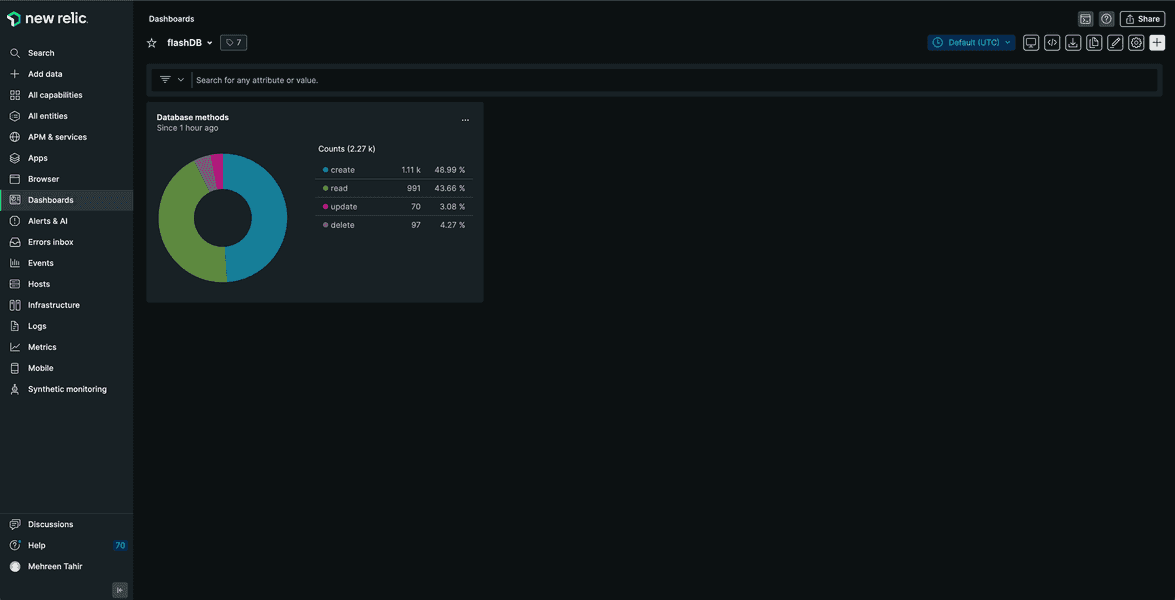
You can add more charts to your dashboard following the same pattern. To do so, click + in upper right hand corner.
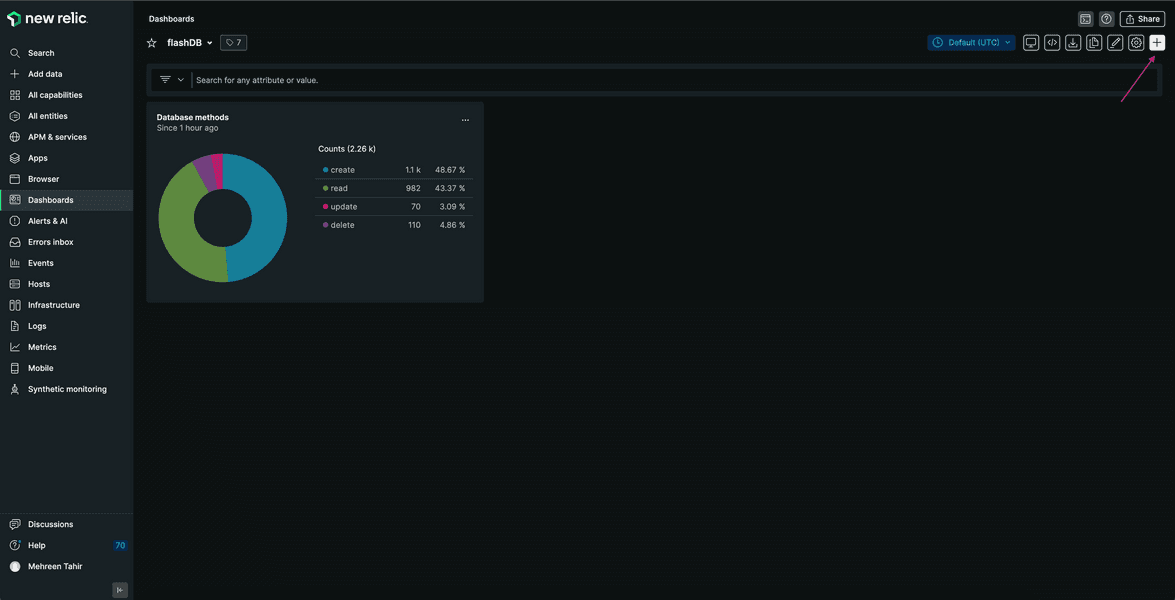
This takes you to the same Add to your dashboard page. Add another chart to your dashboard.
Average response time
Run the following query to observe the average response time of FlashDB queries.
SELECT average(fdb_create_responses), average(fdb_read_responses), average(fdb_update_responses), average(fdb_delete_responses) FROM Metric TIMESERIES
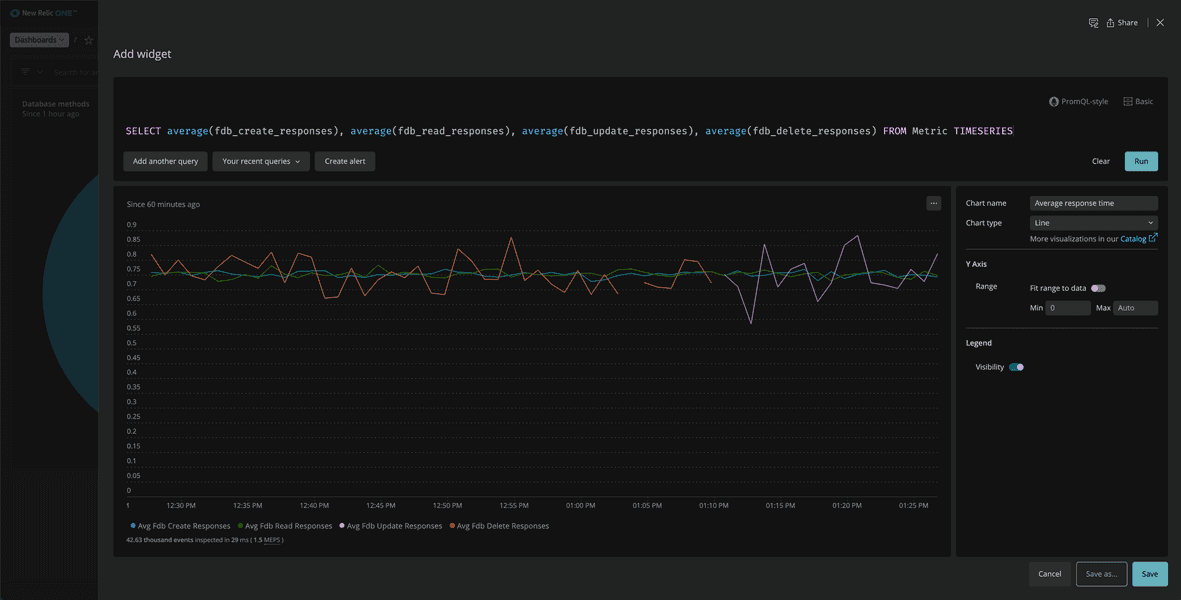
Here, you observe the average response time for different FlashDB queries. Click Save to add this chart to your dashboard. Follow the same procedure to add the rest of the charts.
Errors
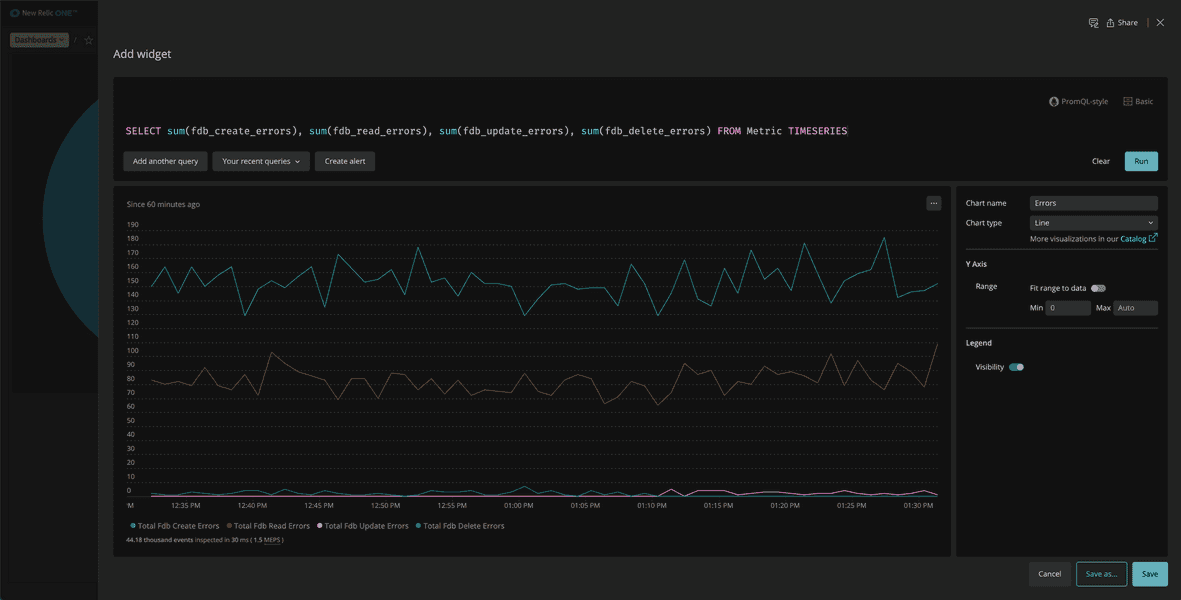
For the Errors chart, use the following query:
SELECT sum(fdb_create_errors), sum(fdb_read_errors), sum(fdb_update_errors), sum(fdb_delete_errors) FROM Metric TIMESERIESHere, you observe errors for all database queries.
Database size
Use the following query to get Database size chart.
SELECT latest(fdb_size) FROM Metric
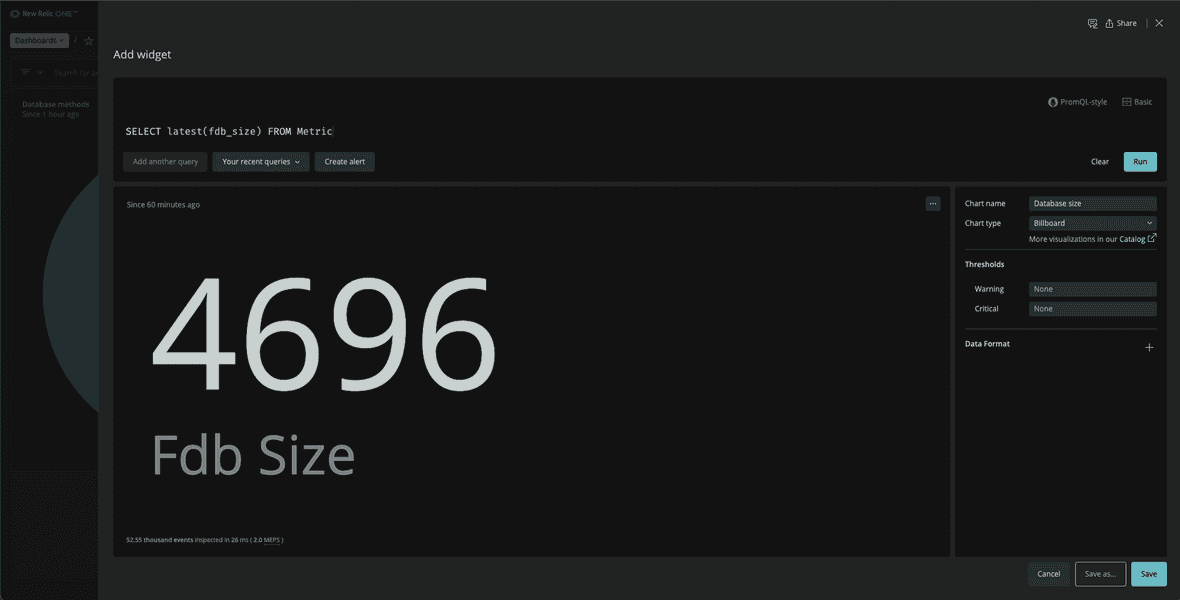
This chart shows you the database size.
Cache hits
For the Cache hits chart, use the following query:
SELECT sum(fdb_cache_hits) FROM Metric TIMESERIES
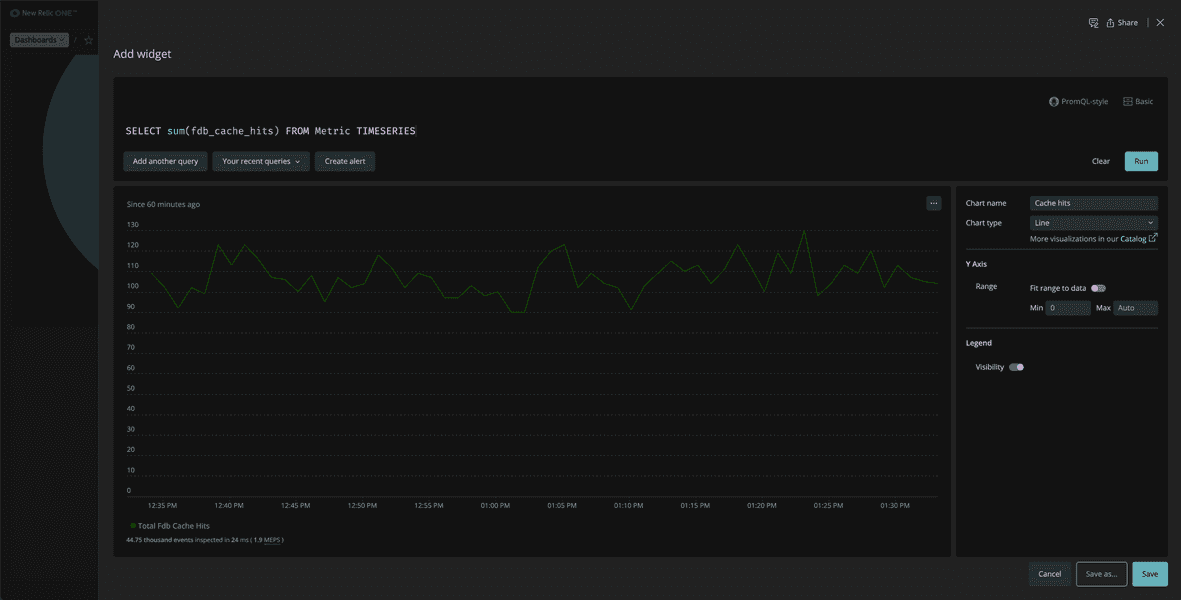
Here, you observe the total number of cache hits using a line chart.
Keys
Use the following query to count the number of keys in your database.
SELECT count(fdb_keys) FROM Metric TIMESERIES
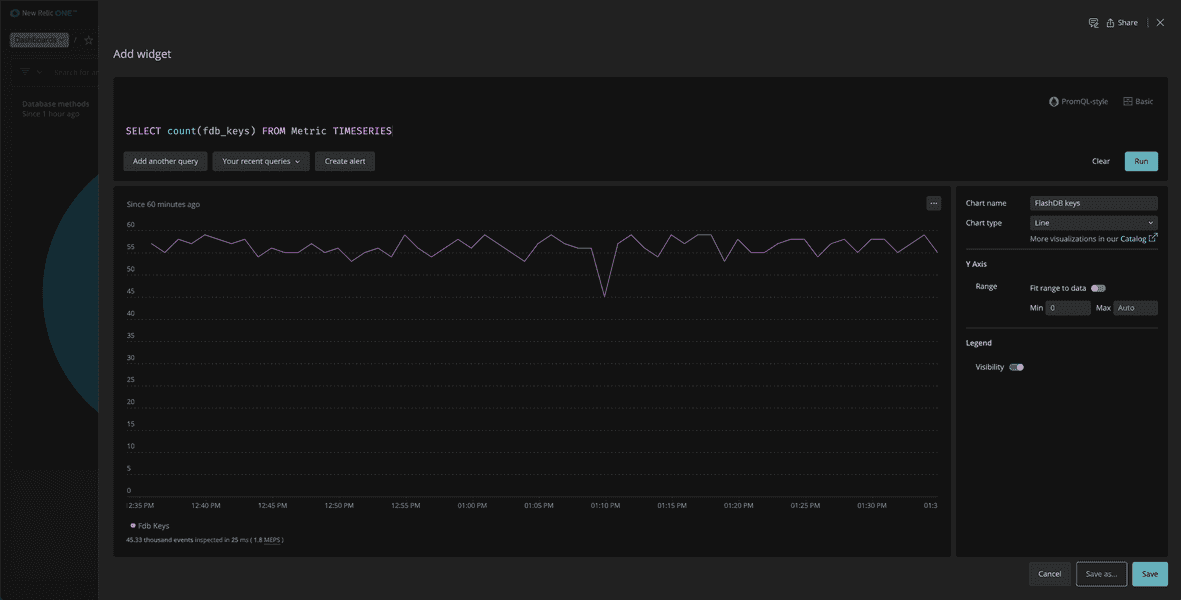
Here, you observe the FlashDB key count.
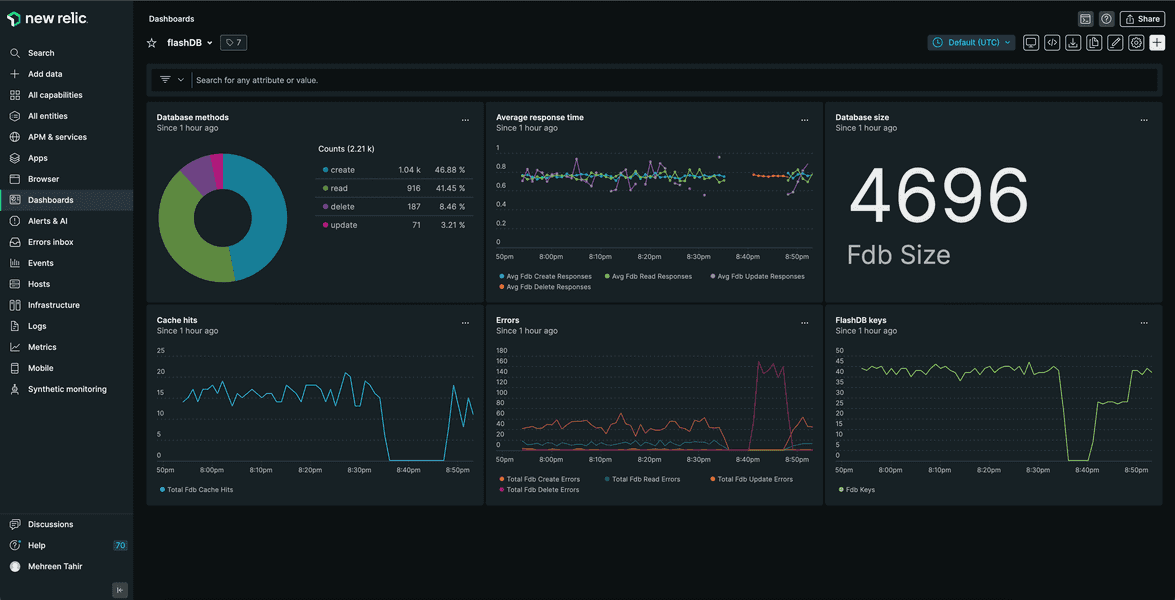
Your final dashboard will look similar to the following:
Summary
In this procedure, you created a dashboard and added multiple charts to it to observe your services in New Relic.
Lab
This procedure is a part of course that teaches you how to build a quickstart. Continue on to next procedure: create alerts.